Perfect Solution For Your Pet
EASY TO USE
Incredible User Interface design makes it easier to use the app for any person, even if he is not tech-savvy.
SECURITY BY DEFAULT
FirmPet app abides by the highest data security parameters to prevent data corruption and unauthorised access.
TECHNICAL SUPPORT
Connect with our expert technical support team to seek help in any technical issues.
Our Fresh Features
Essential curated features for pets that strengthen your pet’s and your lifestyle to lead a healthy, risk-free life.
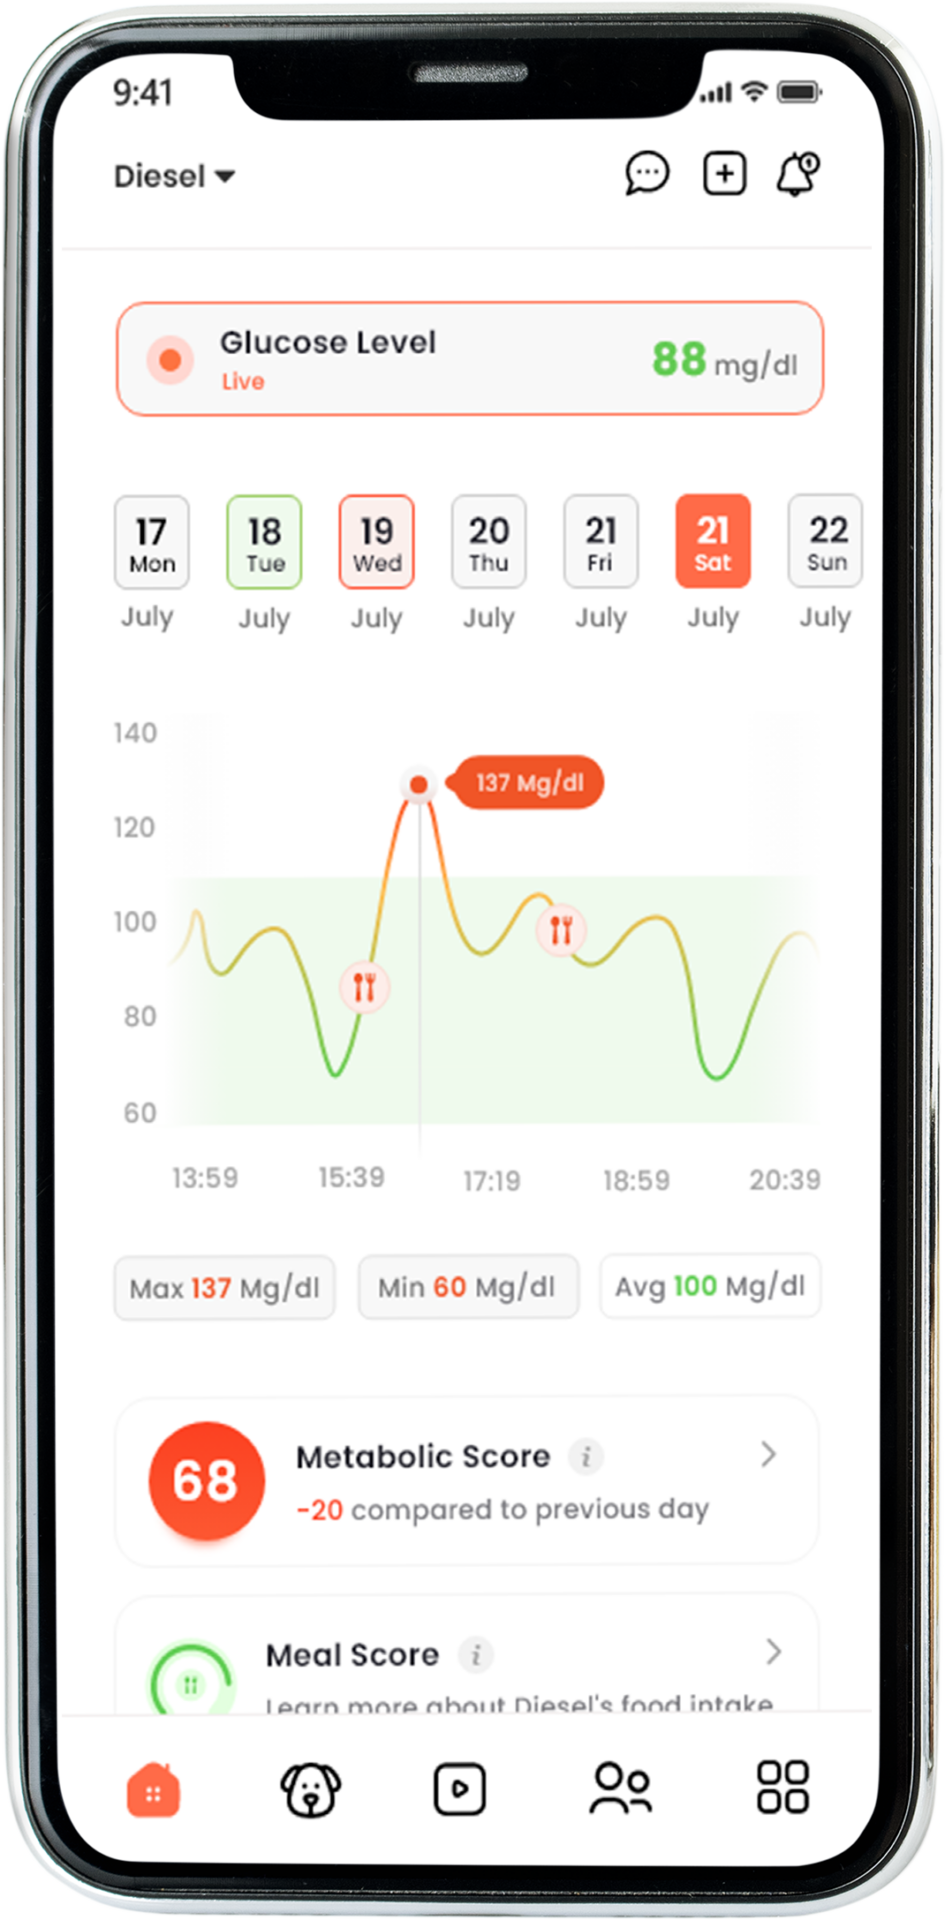
Glucose Reading
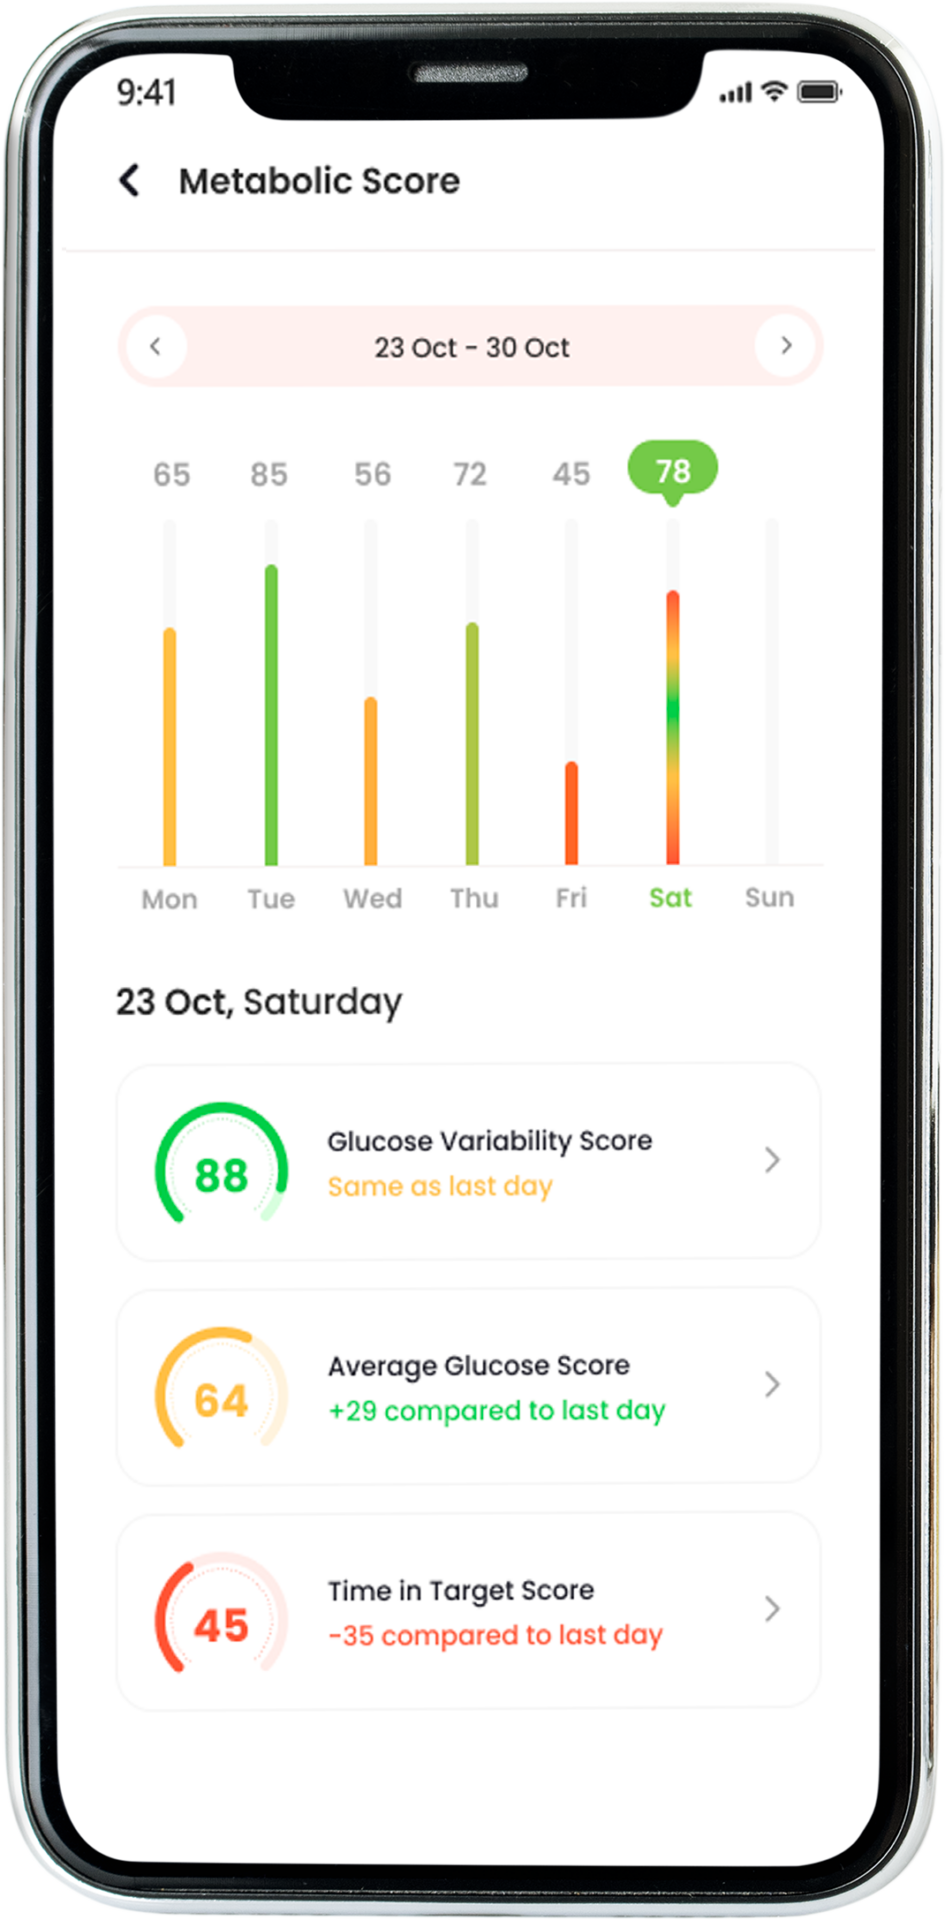
The bar graph clearly explains the ups & downs in the glucose level of pets. Generally, it tends to rise due to an inappropriate diet. Here, you can scroll to study the glucose pattern of the pet for a week and more. You can better analyse the Glucose readings by comparing it to the Maximum, Minimum and Average levels mentioned below.
How FirmPet Work
FirmPet gives you a feature-rich experience that helps you ease the process of taking care of your pets and give them the lifestyle they deserve.
Music Therapy
Get access to specially curated music playlists to calm your pets and cheer them up as per different pet types. (Coming Soon)

Professional Vets
Contact the veterinarian of your choice to consult about your pet for treatment.
Training Videos
Train your pets to learn behavioral aspects and make a friendly bond with them.


Detailed Report
Get PDF reports for a fortnight or a month directly in the app itself to analyse the pet’s metabolic health. (Coming Soon)

Community Feed
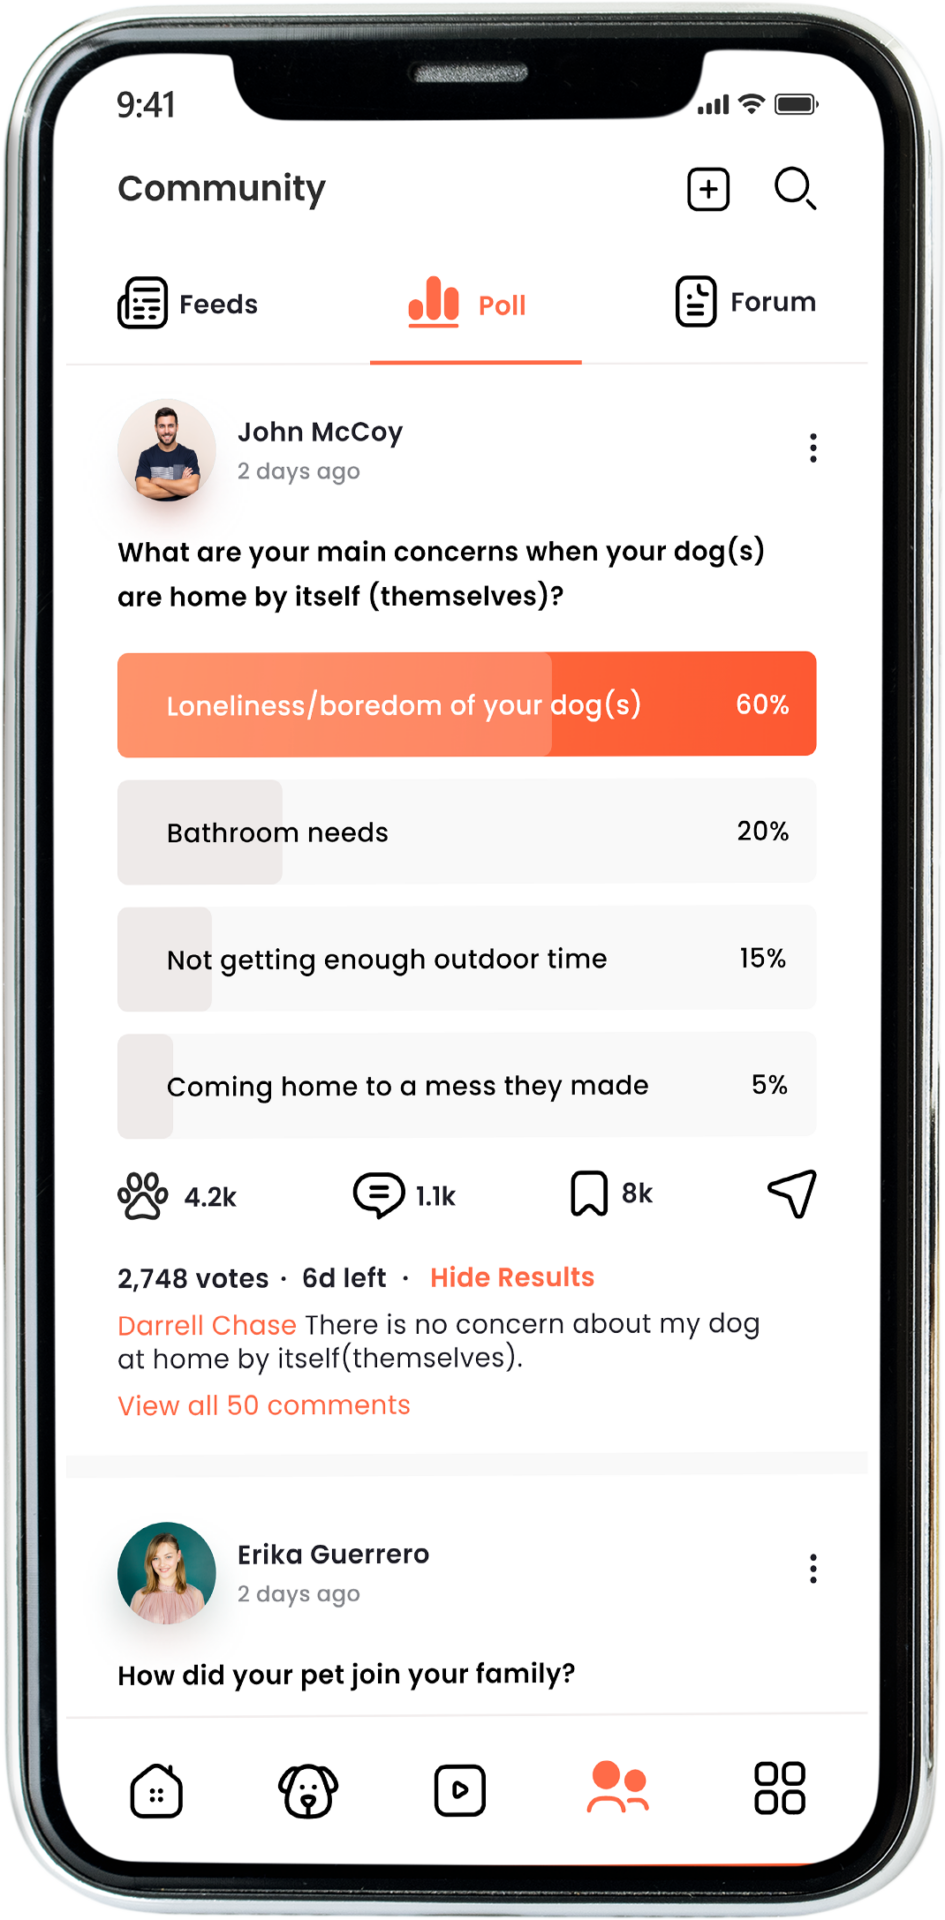
Post pictures of your cute pets and view, like, share and comment on other pet photos from your Feed.

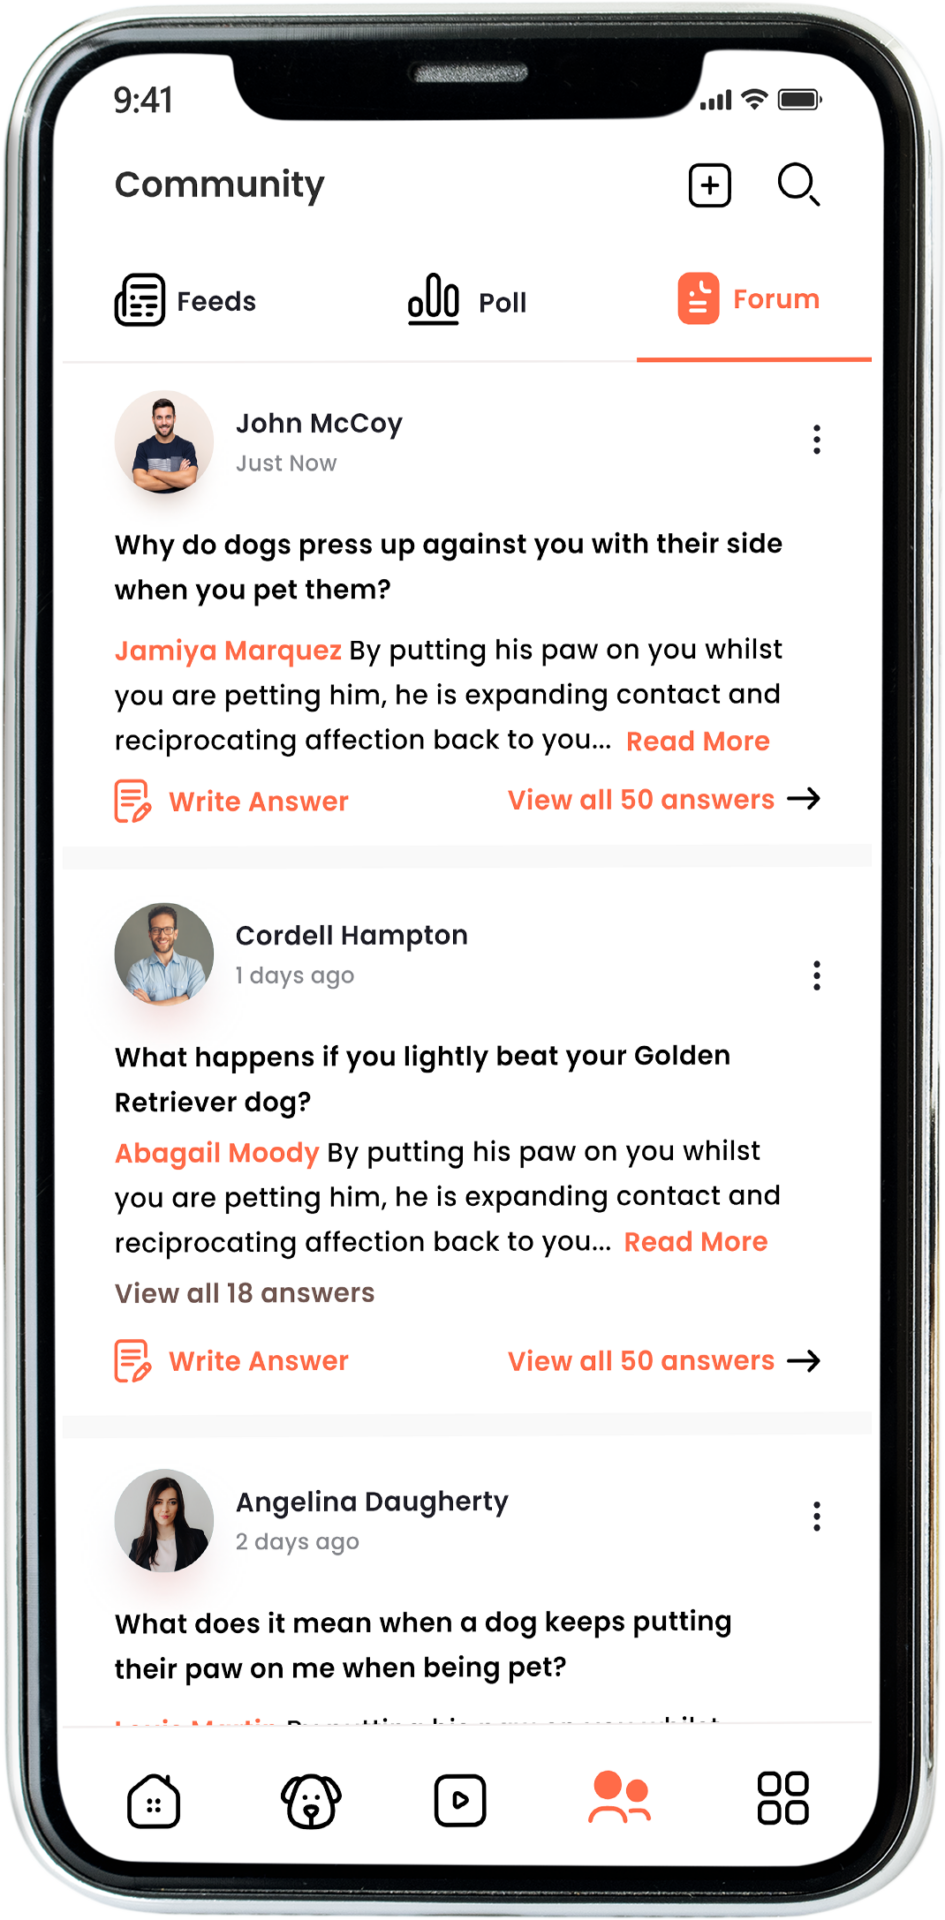
Polls & Forum
Ask questions to get your queries solved by the community expert. Create polls and know what the community thinks
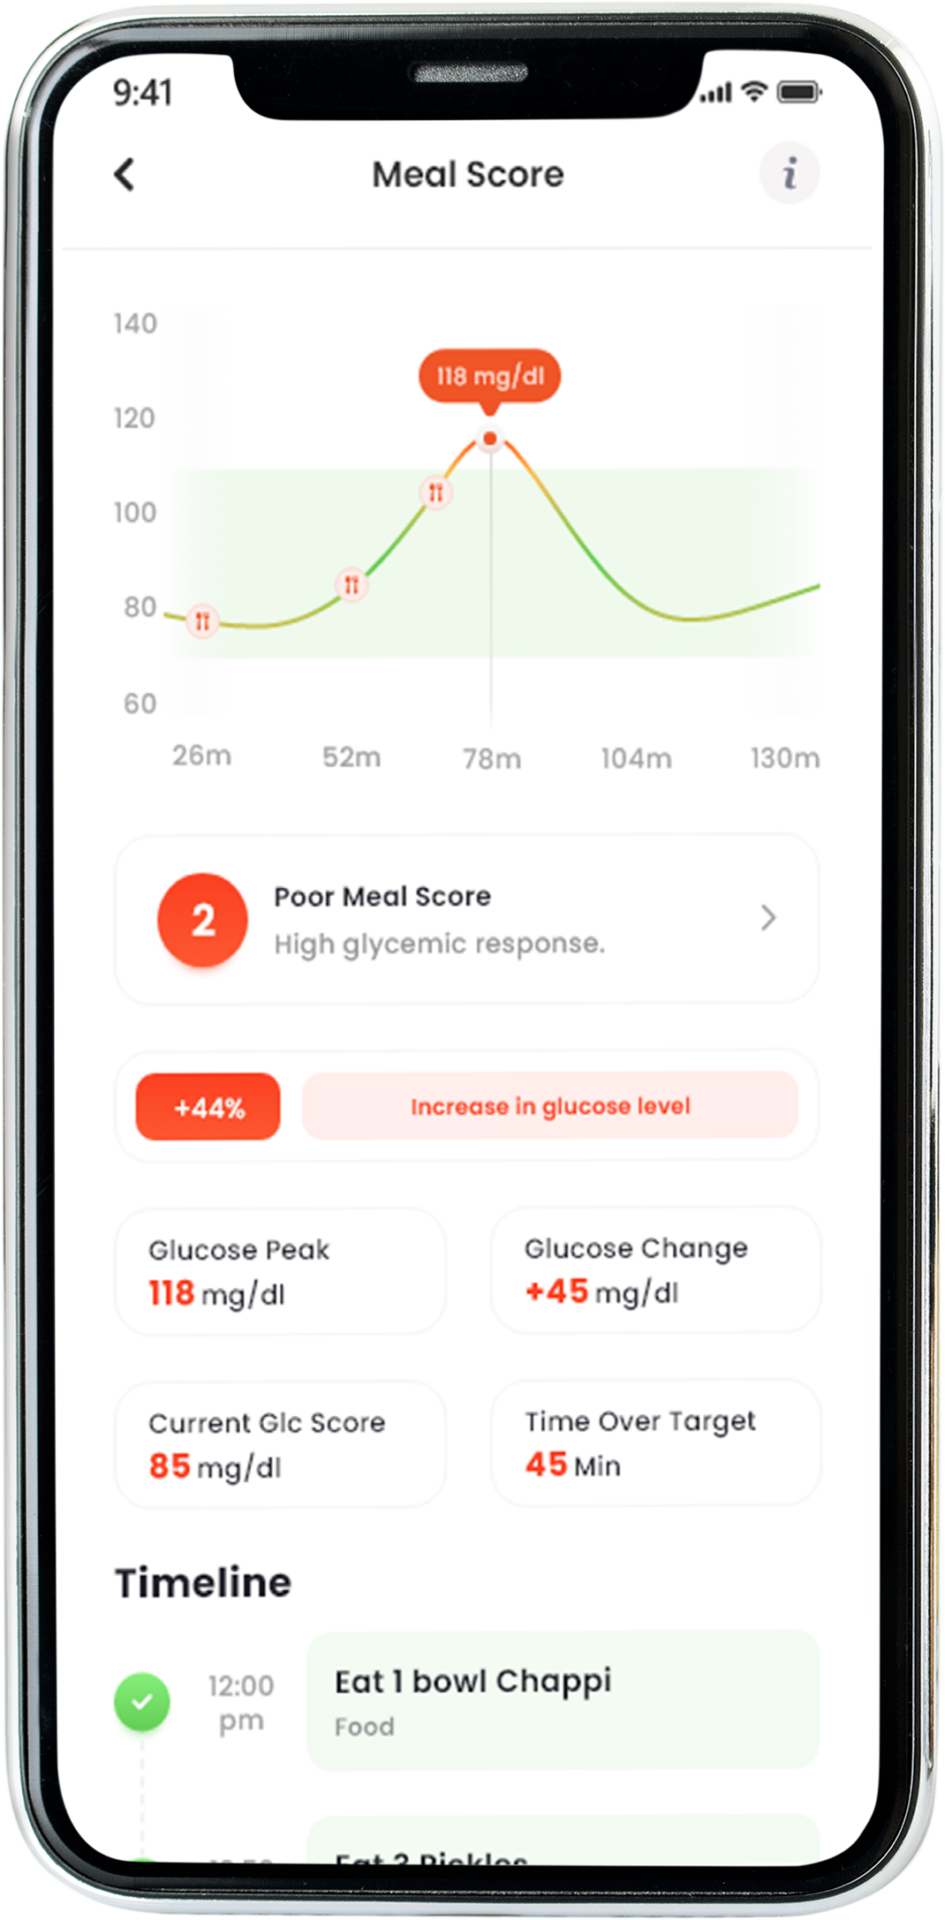
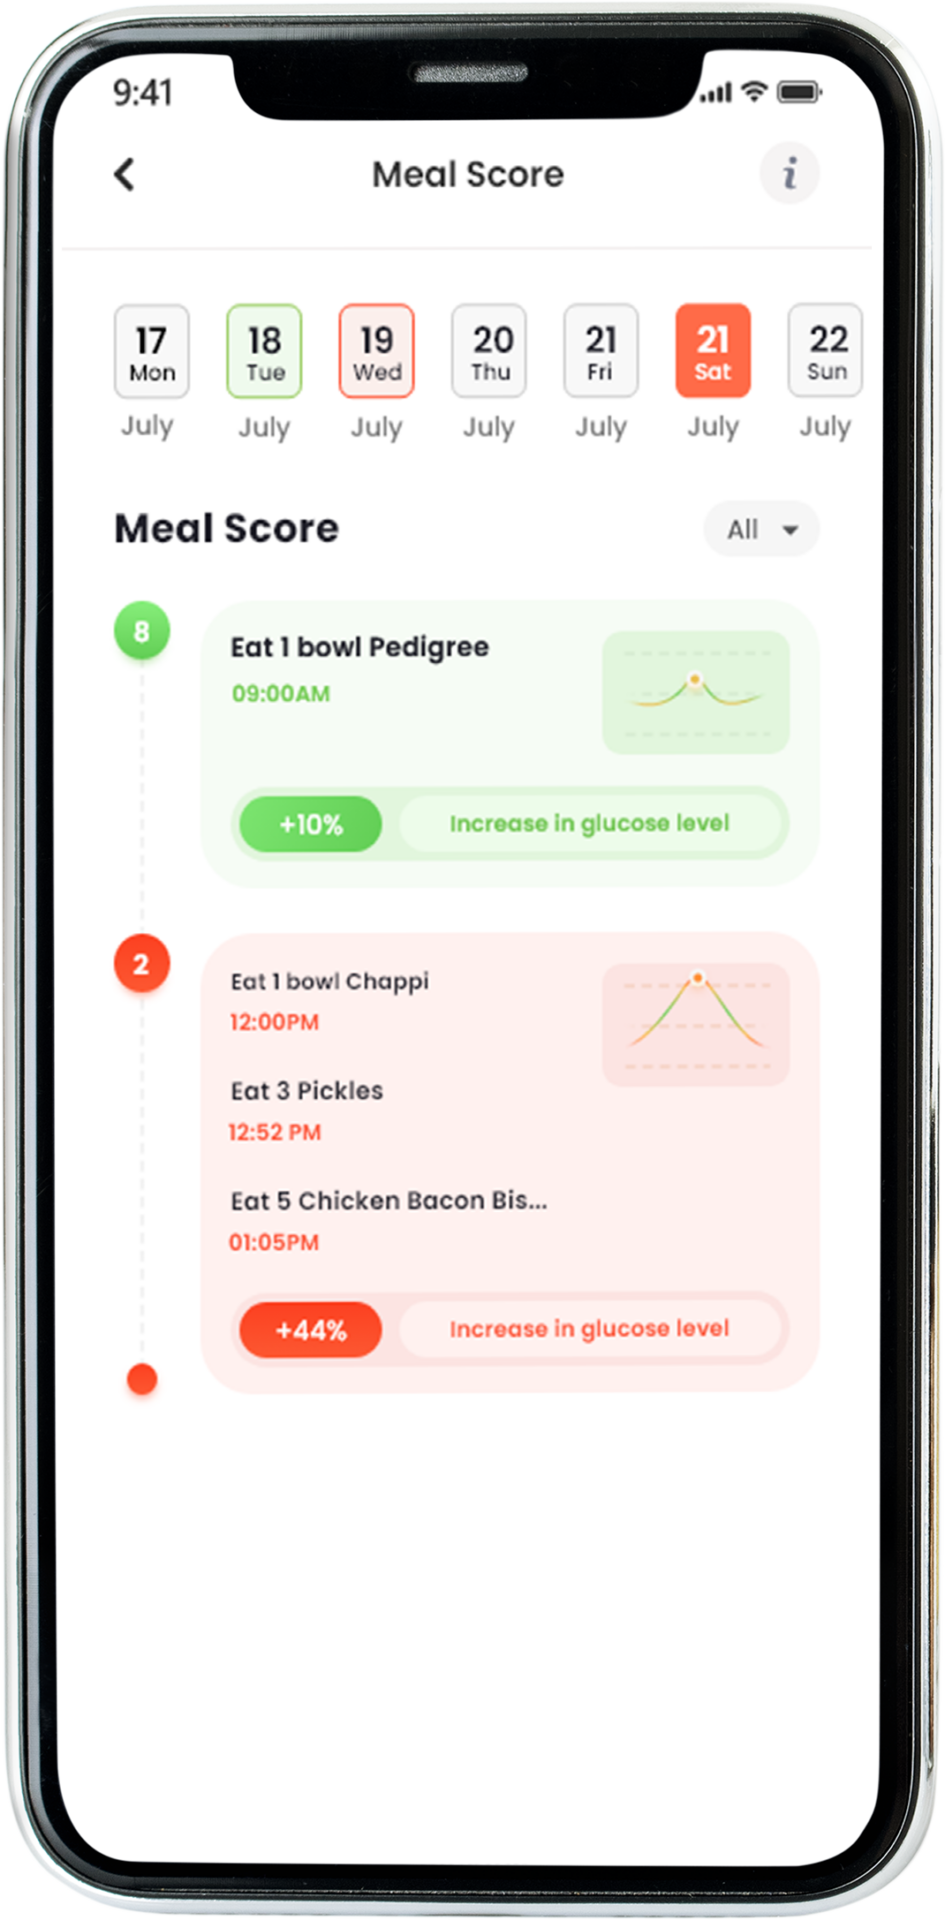
Diet & Meal score
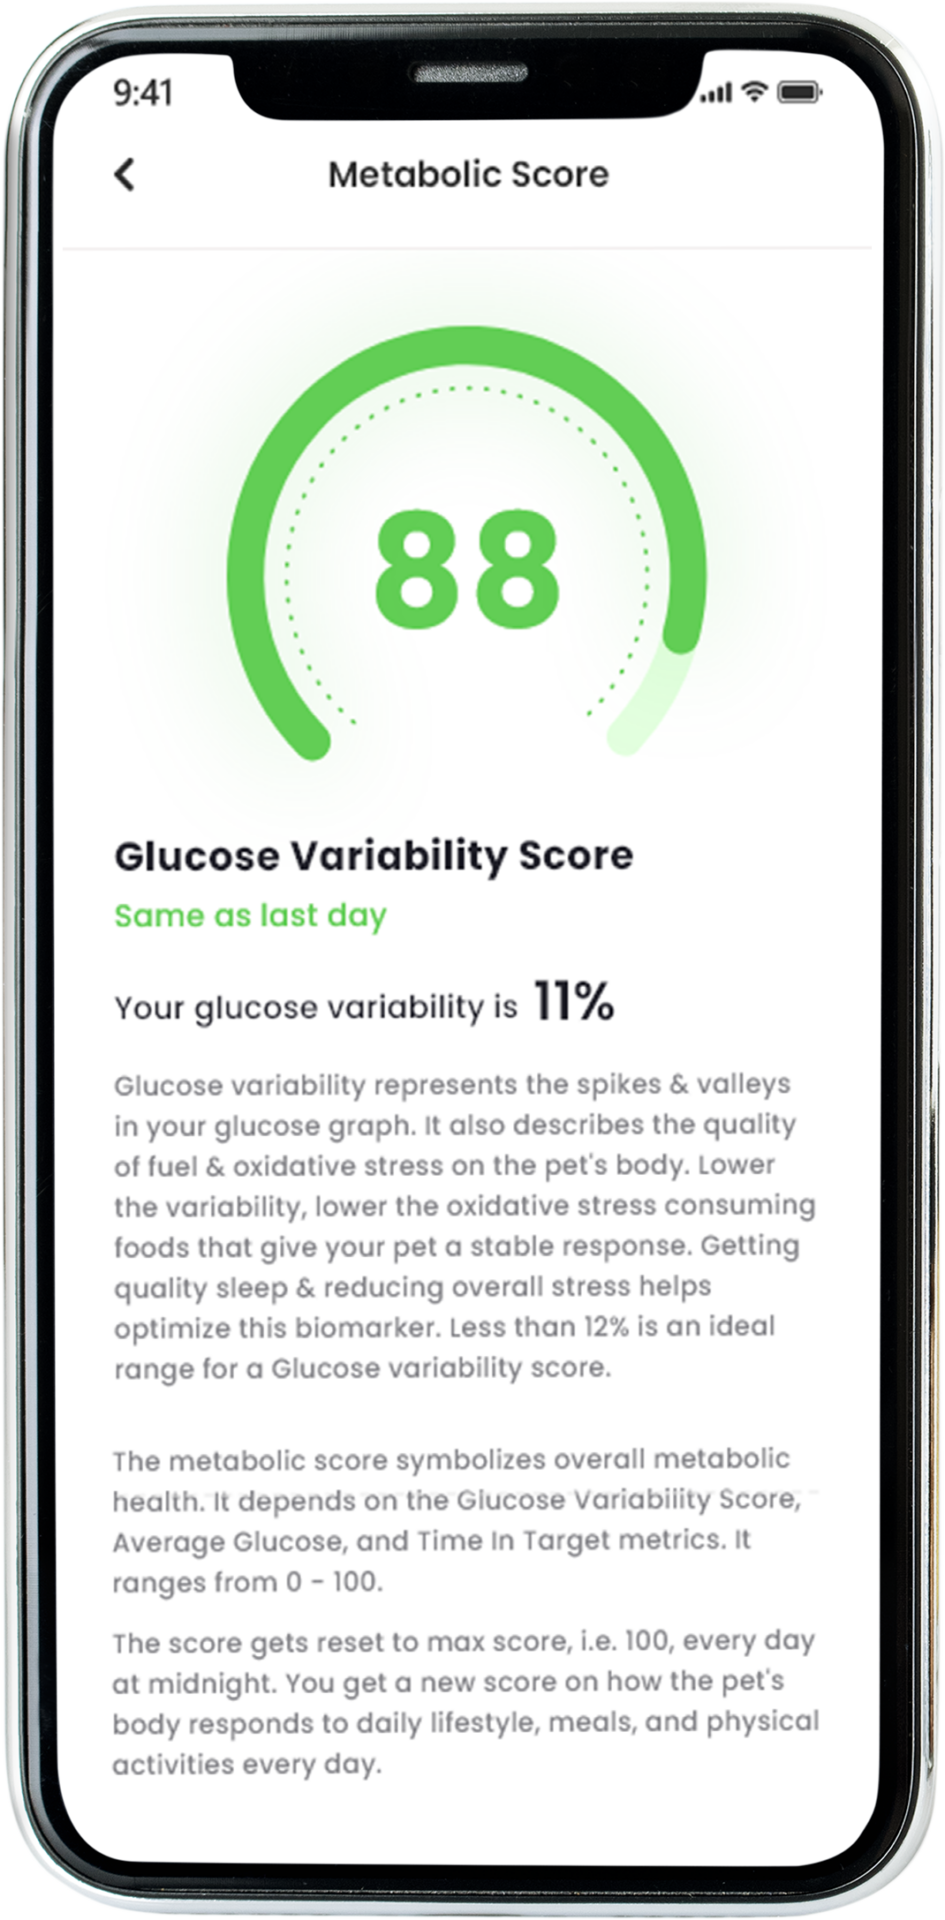
Learn the glycemic response of the pets for different meals. A controlled and stabilised graph depicts the ideal Meal score. Physical attributes such as stress level, sleep quantity and microbiome health also impact it.
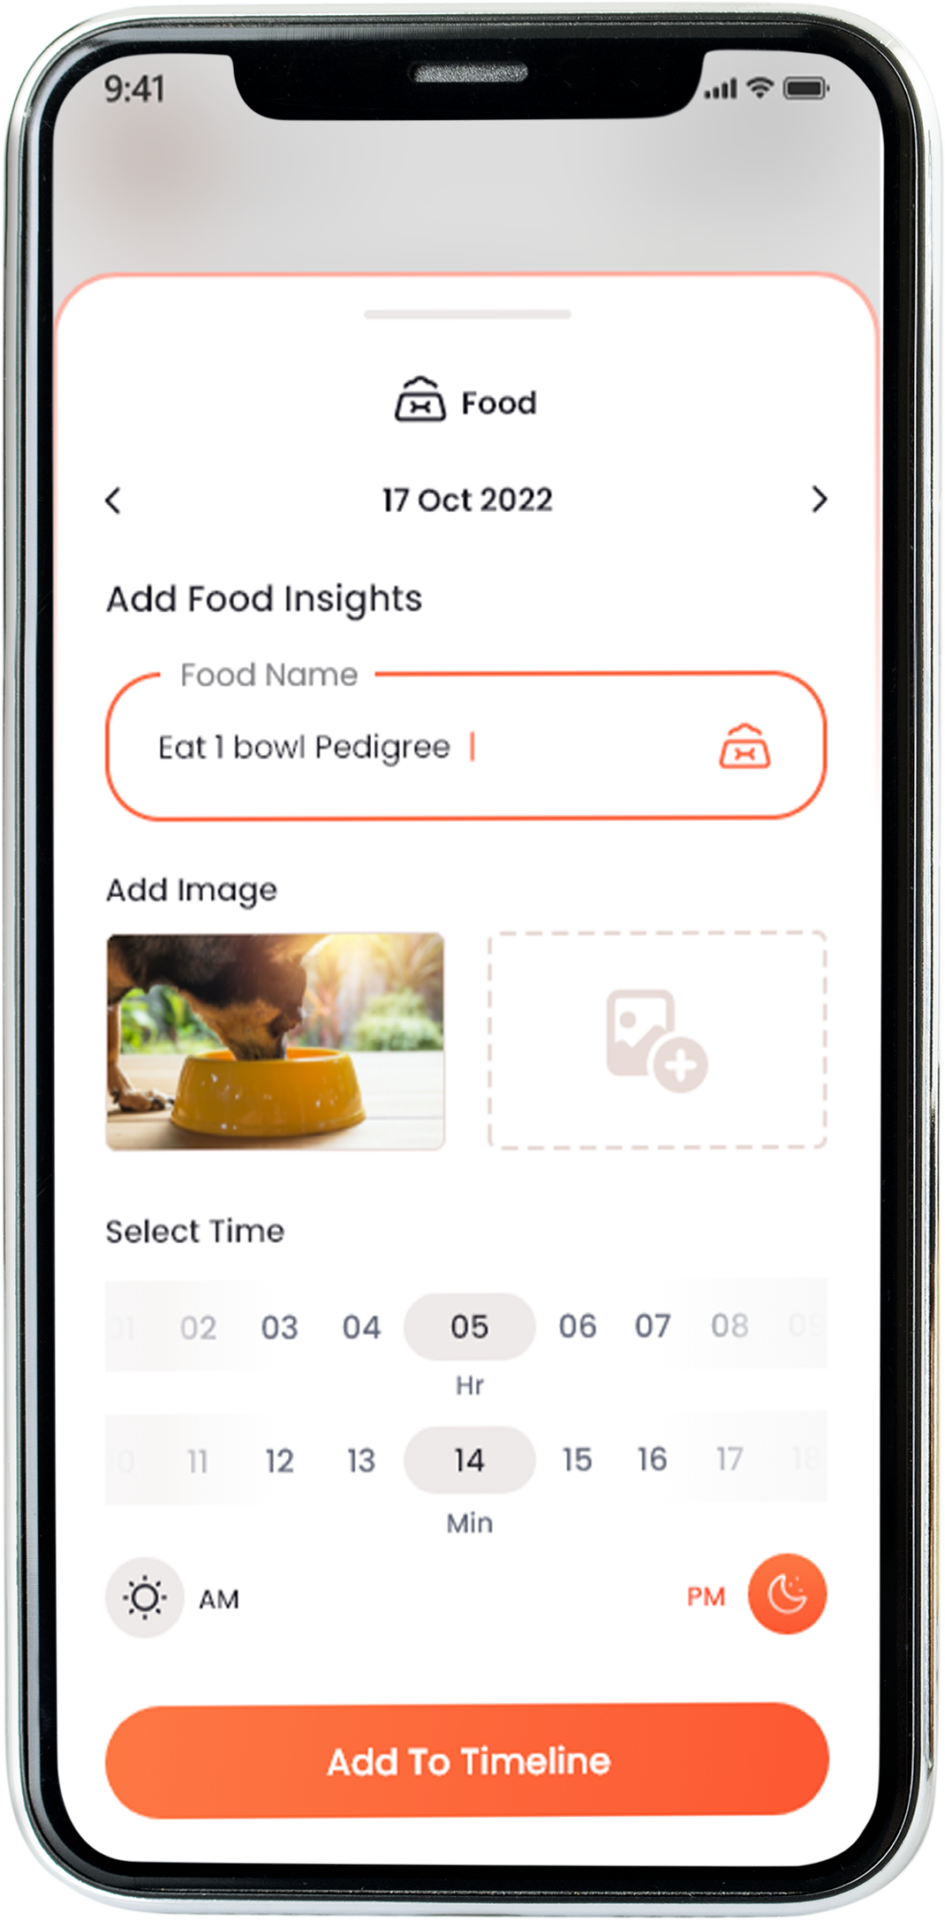
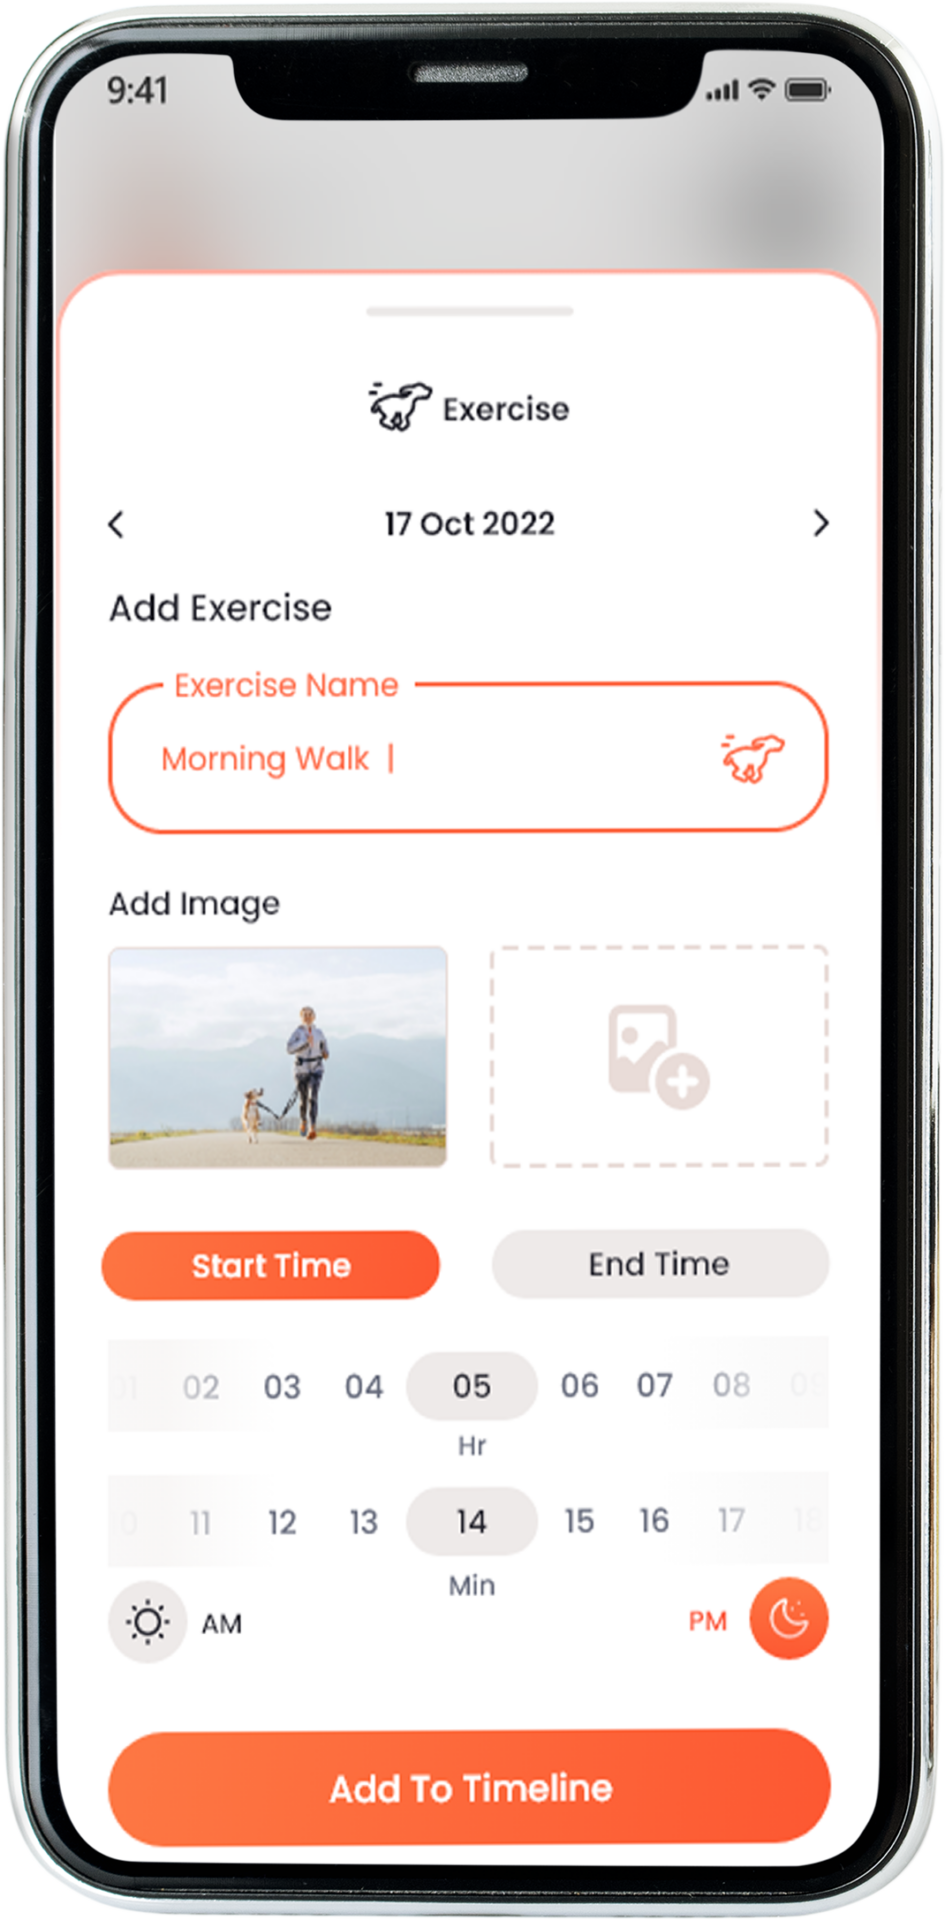
Food & Exercise
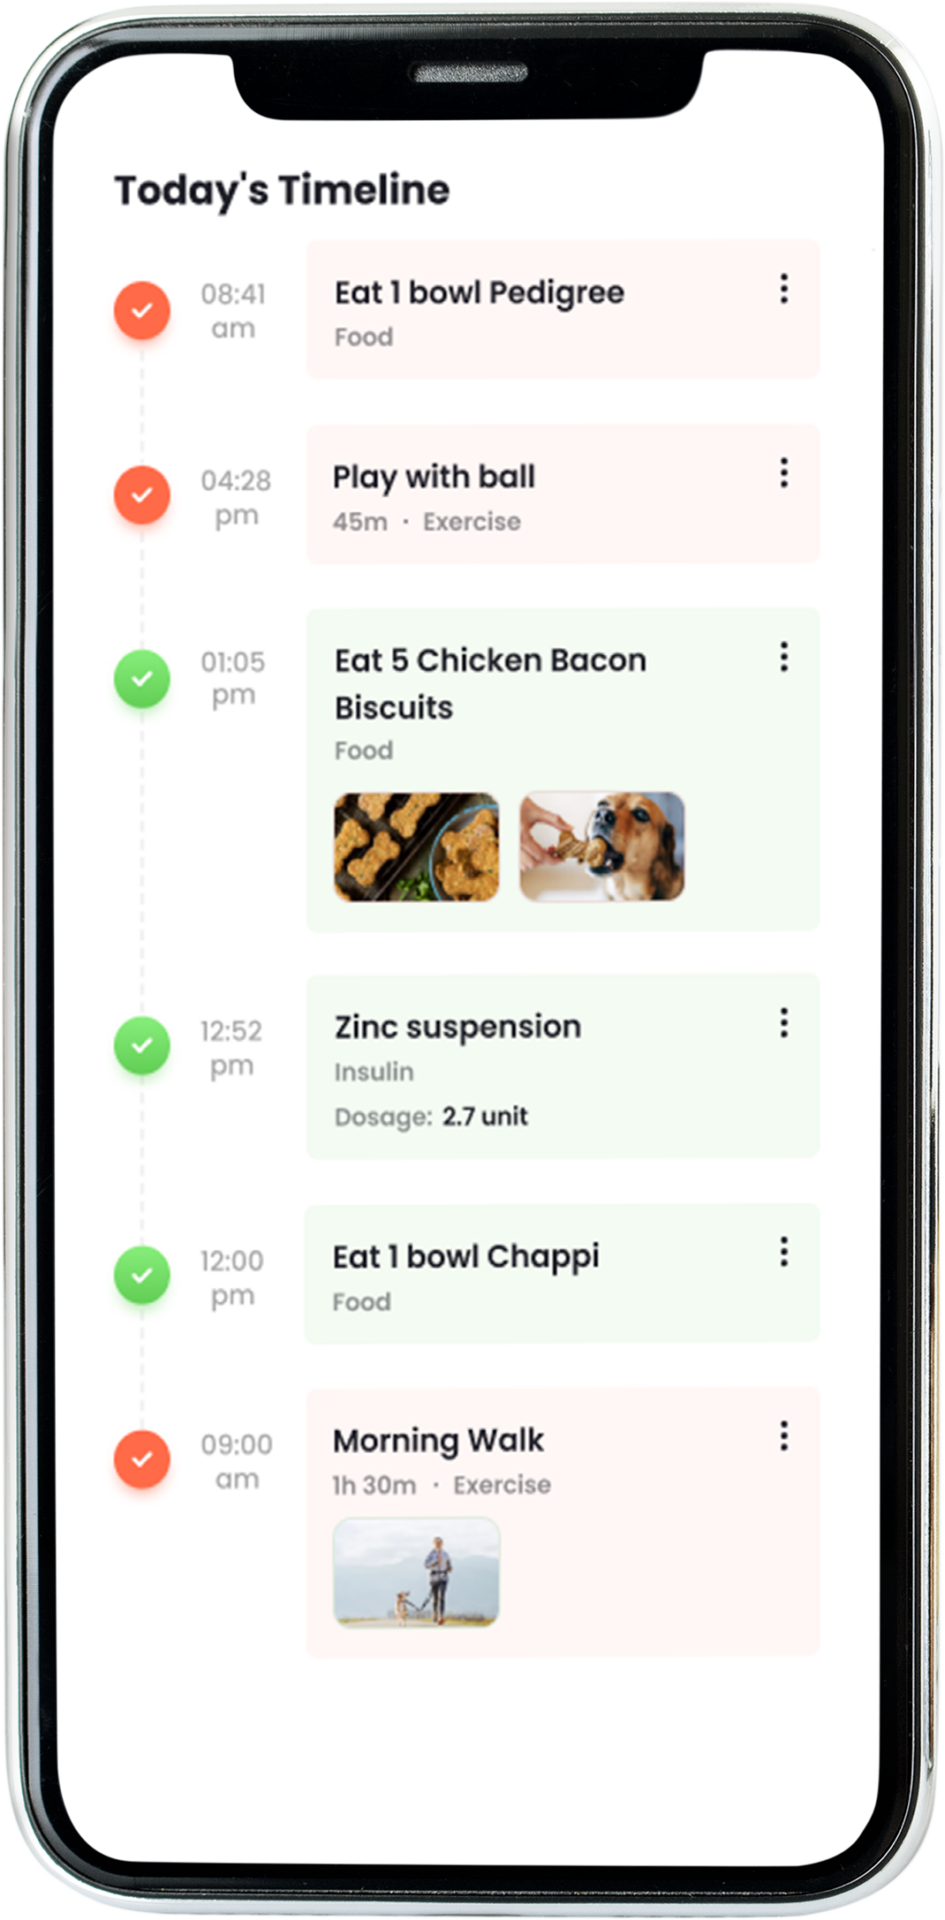
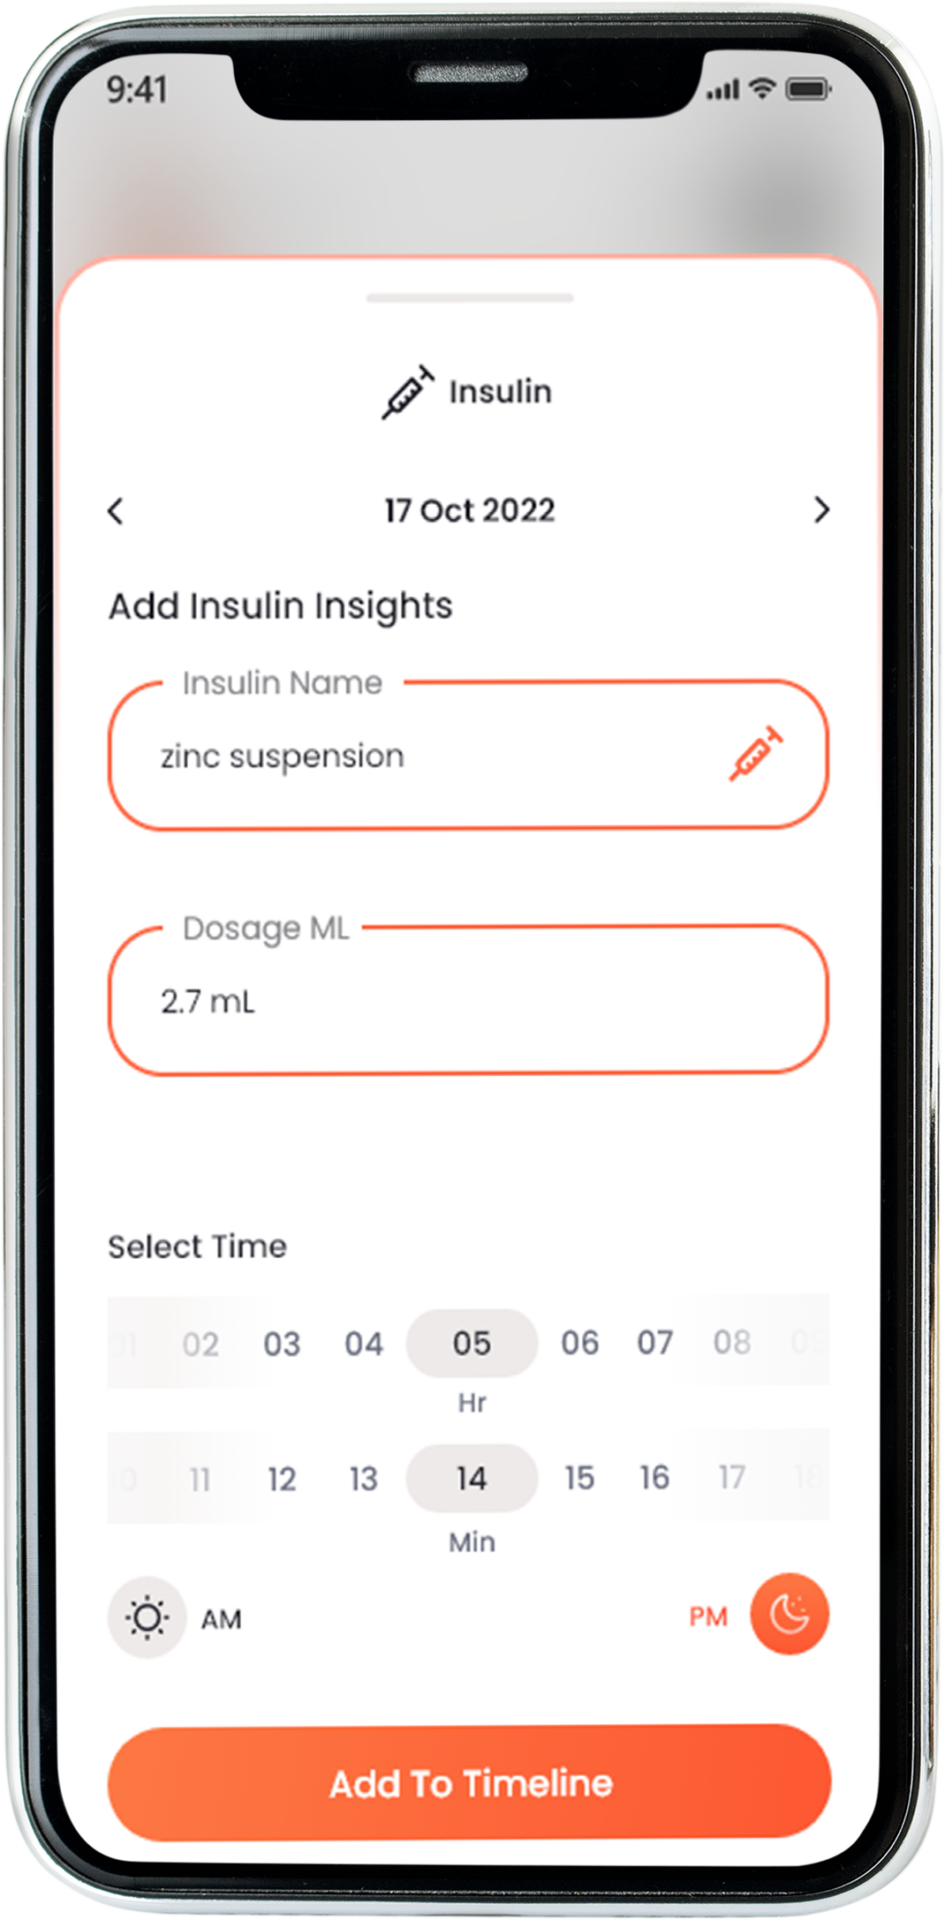
Add food, exercise and other activity details in the log with the exact date and time of the activity. Manually adding the data will help you make better feeding decisions for your pet and maintain their glucose level. Tracking daily activity will ensure good pet health and reduce the risk of diseases.


